
Google PageSpeed Insights Explained: Complete Beginner's Guide
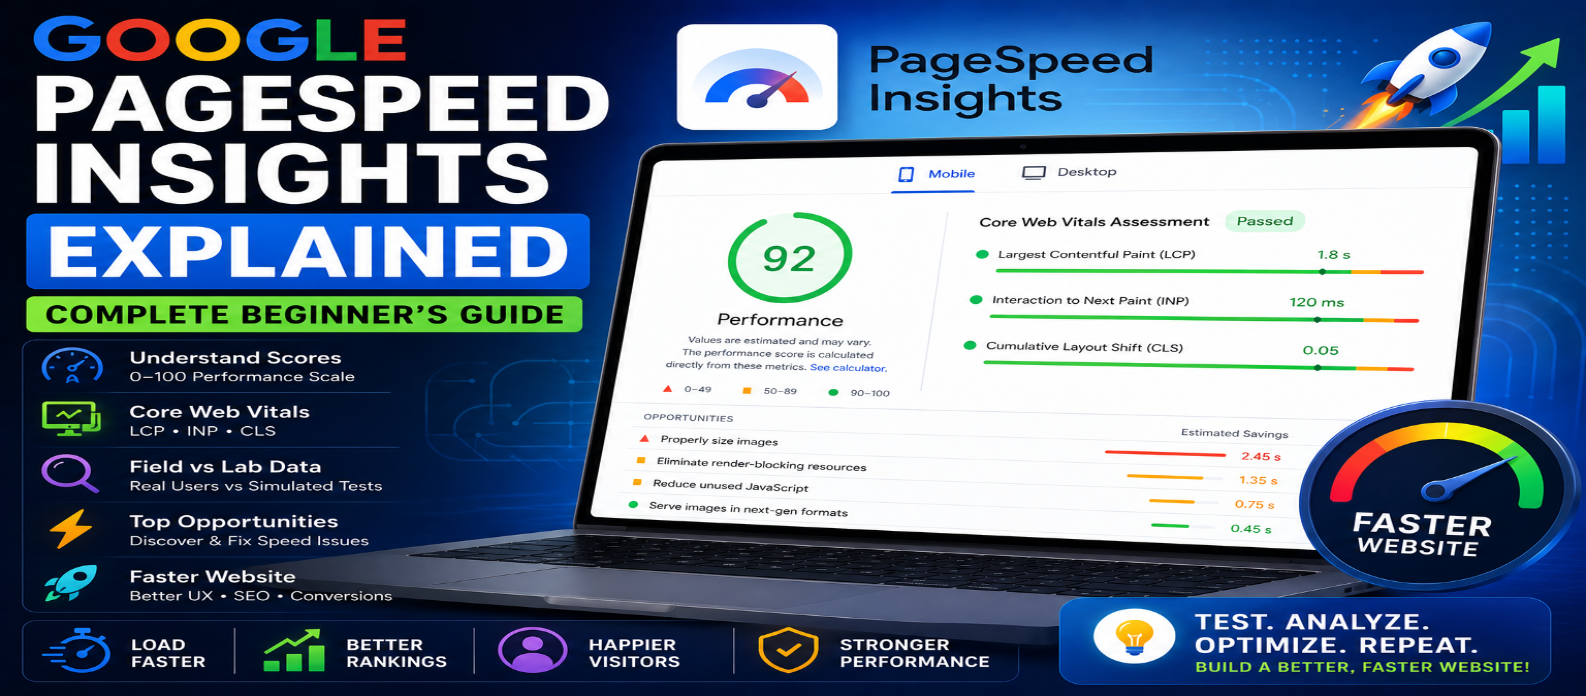
"Learn how Google PageSpeed Insights works with this complete beginner's guide. Understand performance scores, Core Web Vitals, LCP, INP, CLS, field vs lab data, common speed issues, and practical ways to make your website faster."
Google PageSpeed Insights Explained: Complete Beginner's Guide
Website speed plays an important role in user experience, SEO, engagement, and conversions. A website that loads slowly can frustrate visitors, especially on mobile devices and slower internet connections.
Google PageSpeed Insights is one of the most popular tools for measuring webpage performance. It helps website owners and developers understand how a page performs and identifies opportunities for improvement.
If you're new to website optimization, the scores, Core Web Vitals, and technical recommendations may initially seem confusing. This complete beginner's guide explains Google PageSpeed Insights, how its scores work, what the important metrics mean, and how to improve your website performance.
What Is Google PageSpeed Insights?
Google PageSpeed Insights, commonly called PSI, is a performance-analysis tool that evaluates webpages on mobile and desktop.
You enter a webpage URL, and the tool generates a report containing information about performance and areas that may need improvement.
PageSpeed Insights can help identify issues involving:
- Loading speed
- Core Web Vitals
- Images
- JavaScript
- CSS
- Server response
- Browser caching
- Render-blocking resources
- Layout stability
- User interaction
The goal isn't simply to achieve a perfect score. The real objective is to create a fast and responsive experience for actual visitors.
Field Data vs Lab Data
One of the most important things beginners should understand is the difference between field data and lab data.
Field Data
Field data represents performance information collected from real Chrome users when sufficient data is available.
It helps show how visitors experience your website under real-world conditions involving different devices, connections, and environments.
Lab Data
Lab data is generated by testing the page in a controlled environment.
It is particularly useful for diagnosing performance problems and testing changes during development.
The two can produce different results because they measure performance under different conditions.
Understanding the PageSpeed Performance Score
PageSpeed Insights provides a Lighthouse performance score from 0 to 100.
Scores are generally displayed in three ranges:
- 90–100: Good
- 50–89: Needs improvement
- 0–49: Poor
A score of 100 can be attractive, but it shouldn't become your only goal.
A website scoring below 100 can still provide an excellent experience, while chasing a perfect score may sometimes require changes that provide little real benefit.
Focus first on major performance problems and real-user experience.
What Are Core Web Vitals?
Core Web Vitals are metrics designed to measure important aspects of webpage experience.
The three Core Web Vitals are:
1. Largest Contentful Paint (LCP)
LCP measures loading performance by tracking when the main visible content is rendered.
A good target is:
LCP ≤ 2.5 seconds
Large hero images, slow servers, render-blocking resources, and heavy scripts can contribute to poor LCP.
2. Interaction to Next Paint (INP)
INP measures how responsive a page is to user interactions.
A good target is:
INP ≤ 200 milliseconds
Heavy JavaScript and long tasks can make interactions feel slow.
3. Cumulative Layout Shift (CLS)
CLS measures unexpected movement of visible page content.
A good target is:
CLS ≤ 0.1
Common causes include images without dimensions, dynamically inserted content, advertisements, and improperly loaded fonts.
What Does "Core Web Vitals Assessment: Passed" Mean?
When PageSpeed Insights reports that your page passes the Core Web Vitals assessment, it means the available real-user data meets the recommended thresholds for the Core Web Vitals at the required percentile.
This is more meaningful than simply looking at a single Lighthouse performance score because it reflects real-world visitor experiences when field data is available.
Why Mobile and Desktop Scores Are Different
Many beginners are surprised when their mobile score is much lower than their desktop score.
This can happen because mobile testing represents more constrained conditions.
Mobile devices may have:
- Less processing power
- Slower network conditions
- Smaller screens
- Different resource-loading behavior
Therefore, don't assume something is broken simply because mobile and desktop scores differ significantly.
Instead, examine the specific recommendations provided for each environment.
Understanding PageSpeed Insights Opportunities
PageSpeed Insights may identify several opportunities for improvement.
Common recommendations include:
Properly Size Images
Don't serve a huge image when the page displays it at a much smaller size.
Resize and compress images appropriately.
Use Modern Image Formats
Formats such as WebP and AVIF can often reduce image file sizes while maintaining good visual quality.
Eliminate Render-Blocking Resources
Some CSS and JavaScript can delay the rendering of important page content.
Prioritize critical resources and defer non-essential ones where appropriate.
Reduce Unused JavaScript
Large scripts can increase download, parsing, and execution time.
Remove unnecessary libraries and load JavaScript only where needed.
Reduce Unused CSS
Unused styles increase resource size.
Remove unnecessary CSS and keep production stylesheets efficient.
Improve Server Response Time
Slow hosting, inefficient backend processing, or database problems can delay the initial response.
Improving infrastructure and backend performance can help.
How to Improve Your PageSpeed Score
Start with the highest-impact problems rather than trying to fix every warning.
A practical optimization sequence is:
Images → Server Response → JavaScript → CSS → Fonts → Caching → Third-Party Scripts
You can also:
- Enable compression
- Use browser caching
- Implement lazy loading
- Use a CDN where beneficial
- Minify CSS and JavaScript
- Remove unnecessary plugins
- Reduce third-party scripts
- Optimize database queries
- Avoid unnecessary redirects
Make one major change at a time and test again.
Don't Ignore Third-Party Scripts
Analytics, advertising, social-media widgets, chat tools, tracking systems, and embedded content can affect performance.
Before adding a third-party script, consider whether its business value justifies its performance cost.
Remove services you no longer use instead of allowing old scripts to remain indefinitely.
Why Your PageSpeed Score Can Change
You may test the same page several times and receive slightly different scores.
Performance can vary because of:
- Server conditions
- Network conditions
- Resource loading
- Third-party scripts
- Test environment variations
- Website changes
For this reason, avoid making major decisions based on a single test.
Run multiple tests and look for consistent patterns.
Does PageSpeed Score Affect SEO?
Website performance is relevant to search and user experience, but you should not treat the Lighthouse score itself as a direct ranking number.
SEO depends on many factors, including:
Content Quality + Relevance + Crawlability + Links + Mobile Experience + Technical SEO + Page Experience
Improving performance is valuable because it can make your website easier and more pleasant to use while strengthening its overall technical quality.
PageSpeed Insights Checklist for Beginners
When reviewing your website, check:
Core Web Vitals → LCP → INP → CLS → Images → JavaScript → CSS → Server Response → Caching → Fonts → Third-Party Scripts → Mobile Performance
Fix major problems first, then gradually work through smaller opportunities.
Common PageSpeed Mistakes to Avoid
Avoid:
- Chasing a score of 100 at any cost
- Installing multiple optimization plugins without understanding them
- Removing essential functionality just to increase the score
- Compressing images until they look poor
- Ignoring mobile performance
- Ignoring real-user data
- Testing only once
- Treating every warning as equally important
Performance optimization should balance speed, functionality, design, accessibility, and user experience.